
Competitive challenge
Economic sciences
Finance
Regression
Time series
10MB to 1GB
Intermediary level
Dates
Started on Jan. 1, 2019
Challenge context
Napoleon Crypto
November 20, 2018
Description of the Company
Napoleon Crypto (NC) is a company specialised in designing quantitative investment solutions, i.e. investment solutions based on algorithms. While NC has developed several performing algorithms (called strategies), it aims at creating a process optimising the allocation between these algorithms. NC has developed a platform where some of these strategies are published: NaPoleonX
Problem description
The problem is a prediction challenge that aims at helping the Company to build an optimal blend ofquantitative strategies, given a set of such strategies.
A quantitative strategy I can be represented by a time series I = (I_0, ..., I_t, ...) defined for eachtrading day, with I_n+1 = I_n × (1 + r_n+1) where r_n+1 being the performance of the strategy for the trading day n + 1. For any integer k > 0, k × I is also a representation of the quantitative strategy I.
The financial performance of a quantitative strategy can be measured by its Sharpe ratio over a period, which corresponds to its growth performance divided by its volatility on this period. As a consequence, given a set of quantitative strategies and given a period, it is almost always possible to create a linear combination of strategies (blend) whose Sharpe ratio will be better (higher) than the Sharpe ratio of each individual quantitative strategy.
Challenge goals
Goal description:
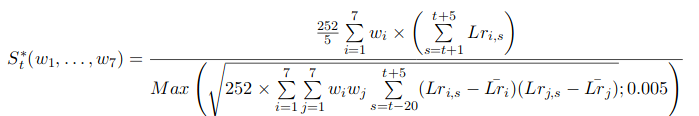
NC’s goal is to find the best allocation among its quantitative strategies every week (more or less 5 trading days), i.e.the combination for which the Sharpe ratio will be the highest over the next 5 trading days. In order to adapt this issue to a ML problem, we have decided to create a challenge consisting in predicting the Sharpe ratio S* of a given combination (w_1, ..., w_7) of strategies, where the Sharpe ratio is slightly modified to avoid near 0 volatility issues. Given the log returns  for each strategy i and time s, the Sharpe ratio of the combination (w_1, ..., w_7) is defined for all time t, as:
Data description
Data description
The input data contains a 7-uplet of weights, then 7 time series of 21 trading days, corresponding to 7 strategies, and then 3 time series of 21 trading days corresponding to 3 financial indicators. Input data, for training and testing, will be given by a .csv file, whose first line contains the header. Then each line corresponds to a sample, each column to a feature. The features are the following:
- ID: Id of the sample which is linked to the ID of the output file;
- (w_1 , ..., w_n ): a 7-uplet of weights ≥ 0 and summing to 1;
- I_1 to I_7: Values of strategies I_1 to I_7 for the past 21 trading days;
- X_1 to X_3: Values of 3 financial indicators for the past 21 trading days.
There will be 10 000 samples for the train set and 4 450 for the test set. For a given sample, the time series (for the 7 strategies and the 3 financial indicators) are given over the same 21 trading days. On a given set of 21 trading days, there could be up to 50 different samples (basically the 7-uplets are different, while the 10 time series are the same).
The training outputs are given in a .csv file. Each line corresponds to a sample:
- ID: Id of the sample;
- Target: value of the Sharpe ratio corresponding to the blend defined by the sample ID.
| ID |
Target |
| 0000 |
0.82 |
| 0001 |
1.20 |
| 0002 |
1.53 |
| : |
: |
| 9999 |
0.65 |
Metric and benchmark
For each model, the test outputs will be compared to the actual value of the Sharpe ratio of the corresponding blend. But in order to smoothen the extremes, we have decided to apply a function  to the results. The scoring function d between an output vector y_hat = (y_hat_1, ..., y_hat_N) and the real vector y = (y_1, ..., y_N) is defined as:
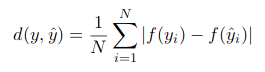
The lower the score, the better.
Contacts
Please send any question to arnaud@napoleonx.ai or stefan@napoleonx.ai.
Benchmark description
Challenge ENS: Napoleon Benchmark
---
Arnaud Dartois and Stefan Duprey
Napoleon Crypto
November 20, 2018
---
Benchmark
In the simplest way possible we have chosen as benchmark the average of the training period: 1.200344.
Metric
You can find in the file metric.py the python code for our own metric, which correspond to a mean absolut error after applied a sigmoid function on target and prediction.
Data
Training input/output and testing input/output are available in four files named respectively Trainig_Input.csv, Training_Output.csv, Testing_Input.csv and Testing\_Output.csv.

