Machine learning for medical research

Started on Jan. 1, 2019
The goal of this challenge is to develop new algorithms to detect lymph node metastases in histological images of patients diagnosed with breast cancer.
Note 28/01/19 We noticed that downloading data from the website is very slow so we also provide drive links to the data:
reduced data(only resnet features, 2.2 Go)
all data
(all data i.e. resnet features and tiles, 10Go)
Histopathology is the study of the microscopic structure of diseased human tissue. Analysis of histopathology slides is a critical step for many diagnoses, specifically in oncology where it defines the gold standard. Tissue samples are usually collected during surgery or biopsy. After being preprocessed by expert technicians, pathologists review samples under a microscope in order to assess several biomarkers such as the nature of the tumor, cancer staging etc...
Metastasis is the spread of cancer cells from the place where they first formed (here breast) to another part of the body. For patients diagnosed with breast cancer, even after finding the primary tumor, an examination of the regional lymph nodes in the axilla is always performed to determine if the breast cancer metastasized (i.e. if it spread through the lymphatic system).
Metastasis lymph nodes involvement is a criteria for grading breast cancer, and is also a very important prognostic factor for breast cancer survival. Prognosis is poorer when cancer has spread to lymph nodes.
Assessing the presence of metastases in histology images is a demanding, time-consuming task for pathologists, which requires extensive study under the microscope. Highly trained pathologists must review vast whole-slide images of very high digital resolution (100,000 * 100,000 pixels). Identifying small metastases is a tedious exercise and some might be missed.
An automated solution to detect metastases has high clinical relevance as it could help to reduce the workload of pathologists and improve the reliable detection of metastases.
The challenge proposed by Owkin is a weakly-supervised binary classification problem : predict whether a patient has any metastase in its lymph node or not, given its slide.
To each patient corresponds one slide. However, due to the extremely large dimensions of the whole-slide images, we preprocessed the data in the following way. For each slide, we extracted smaller images (tiles) of size 896x896 (then resized at 224x224) and we kept a total of 1000 tiles (or less if there is not enough tissue). Each tile was selected such that there is tissue in it. It is important to note that even for a slide with metastases, those metastases can be very small and localized. Therefore for some tumoral cases, more than 99% of the tiles could be normal tissue. Of course in each tumoral slide, at least one tile is tumoral and in non-tumoral slides, all tiles are normal tissue.

Example of two tiles (non-tumoral on the left, tumoral on the right)
The whole-slide images used in this challenge originally come from Camelyon dataset.
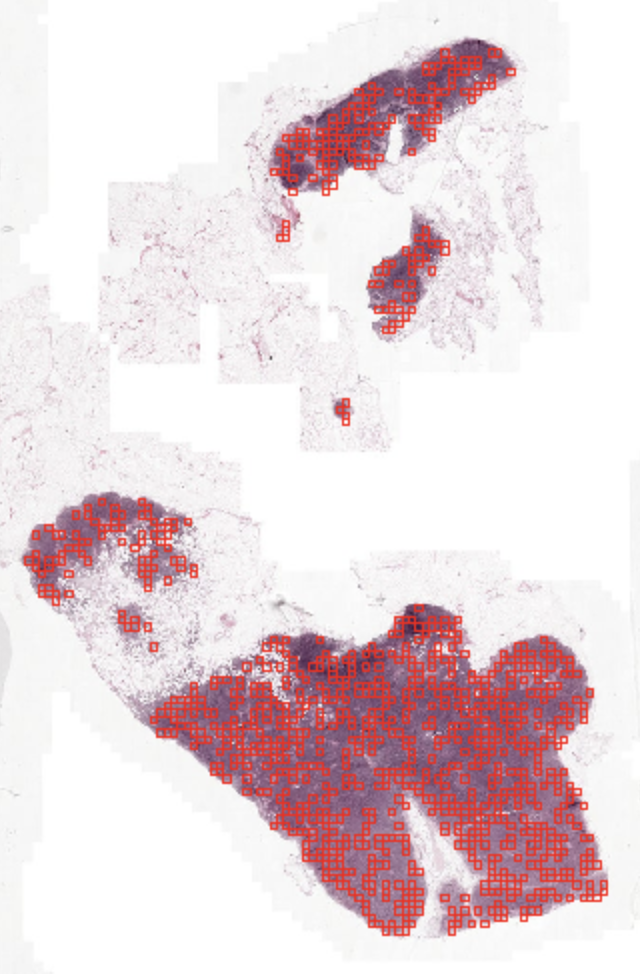
Example of a whole slide image with the tiles selected during preprocessing highlighted in red
Our problem is a weakly-supervised one as we only have labels at the slide level. Indeed even in a tumoral slide, a lot of tiles (often more than 99%) are not tumoral. Labels for the train dataset are in the file train_output.csv.
Furthermore, for some specific cases a pathologist could have locally annotated the slide, which will provide a tile-level labeling and therefore allows a strongly supervised approach. Among our training patients, 11 are fully annotated (with a total of 10,024 annotated tiles).
Those tiles annotations are stored in a csv file named train_tile_annotations.csv. It contains two columns: the first being the tile id builded as following ID_[patient_id]_annotated_tile_[tile_id]_[tile_coords], the second being the actual annotations (0.0 for non tumoral tiles, 1.0 for tumoral tiles).
For each dataset, we provided two types of input : - Image folder (images) - ResNet features folder (resnet_features)
In the image folder (images) is stored a folder per patient, named ID_[patient_id], containing images of size 224*224*3 (i.e. 3d matrices) stored as .jpg files with the following names: ID_[patient_id]_tile_[tile_id][zoom_level][x_coord]_[y_coord].jpg.
Each folder contains a maximum of 1000 tiles but some folders could contain less than 1000 tiles as some whole slide images have less than 1000 tiles of tissue. In this case, if existent, the tile labeling is made through the name of each tile.
In the ResNet features folder (resnet_features) is stored a matrix per patient, named ID_[patient_id].npy, of size [n_tiles] * 2051.
First column is the zoom level, 2nd and 3rd are coordinates of the tile in the slide.
Last 2048 columns are the actual ResNet features.
Again each matrix have a maximum of 1000 rows (one for each tile) but there can fewer than 1000.
The ResNet features have been extracted using ResNet50 pre-trained on the ImageNet dataset. We decided to extract these features to help people who do not have the computing resources or time to train directly from images. However we can definitely think that such a pre-trained ResNet is a sub-optimal feature extractor. For reference, it took 24 hours to extract resnet features for all patients on a 64-core CPU machine.
Outputs must be float numbers between 0.0 and 1.0 which represent the probability that there are metastases in the image.
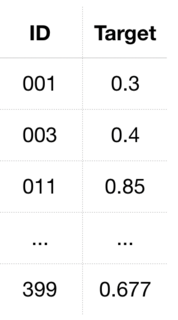
The train output file train_output.csv simply consists of two columns separated by commas denominated ID and Target in the first line (header), where ID refers to the unique identifier of the patient and Target the probability that there are metastases in the histology image of that patient. IDs are sorted by increasing patient ID and formatted as
Solutions file on test input data submitted by participants shall follow the same format as the train output file but with an ID column containing the test patients’ IDs similarly sorted by increasing values.
As such, the ID column of the test output file shall be formatted as
It thus starts with 000, 004, 016 etc. up to 399, as one can see in the image below.
The test set is split for evaluation purposes between two test sets of equal size : test set 1, used to establish the public ranking, and test 2, used to establish final and intermediary rankings. The split between train set, test set 1 and test 2 is: 70% - 15% - 15%.

The metric for the challenge is the Area Under the Curve (AUC) and is computed as follows :
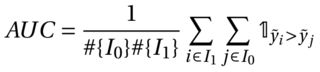
where I1 is the set of indices of patients with label 1 (presence of metastases) and I0 the set of indices of patients with label 0.
A score of 0.5 represents a random prediction and a score of 1.0 represents perfect predictions
Our baseline model is a logistic regression on the mean of the resnet features. This model reaches an AUC of 0.7 on public test set.
The implementation of the baseline is provided in supplementary files
Files are accessible when logged in and registered to the challenge
Challenge data is supported by:
