Dreem

Started on Jan. 4, 2021
Dreem is a french neurotechnology startup which works on the Dreem headband, a tool for sleep analysis and enhancement to help people improve their sleep. The Dreem headband collects physiological activity during sleep, such as brain activity (EEG), respiration and heart rate. Physiological signals are analyzed throughout the night and allows to perform a detailed analysis of sleep.
Sleep Apnea is one of the most common breathing-related sleep disorder. It afflicts arounds 25 % of male and 10% of female. Sleep apnea is characterized by repeated episodes of apnea (breathing stops) and hypnopnea (breathing is insuficient and can cause blood oxigen level disruption). Both these type of episodes can lead to fragmented sleep and daytime sleepiness as well as cardiovascular issues.
However sleep apnea is under-diagnosed and according to the AASM, around 80% of sleep apnea cases are left undetected. To diagnose sleep apnea, one must do one night with a Polysomnography (PSG) which records raw physiological signals (Brain activity with EEG, cardiac activity with ECG, respiratory activity and muscle activity with EMG). The night recording will then be manually analyzed by a trained sleep expert who will detect and count the apnea events. The number of apnea events per hour of sleep (AHI) is the clinical marker of apnea severity. The manual scoring is time consuming, requires trained personals and cannot be done easily at scale.
Hence, the development of automated methods to detect Sleep Apnea would make the apnea diagnosis more efficient and could help to detect the numerous undetected cases.
The goal of this challenge is to build a model to automatically detect sleep apnea events from PSG data.
You will have access to samples from 44 nights recorded with a polysomnography and scored for apnea events by a consensus of human experts. For each of the 44 nights, 200 windows (without intersection) are sampled with the associated labels (which are binary segmentation masks). Each of these windows contains 90 seconds of signal from 8 physiological signals sampled at 100Hz:
The segmentation mask is sampled at 1Hz and contains 90 labels (0 = No event, 1 = Apnea event). Both examples can be reproduced using visualization.py provided in the supplementary files.
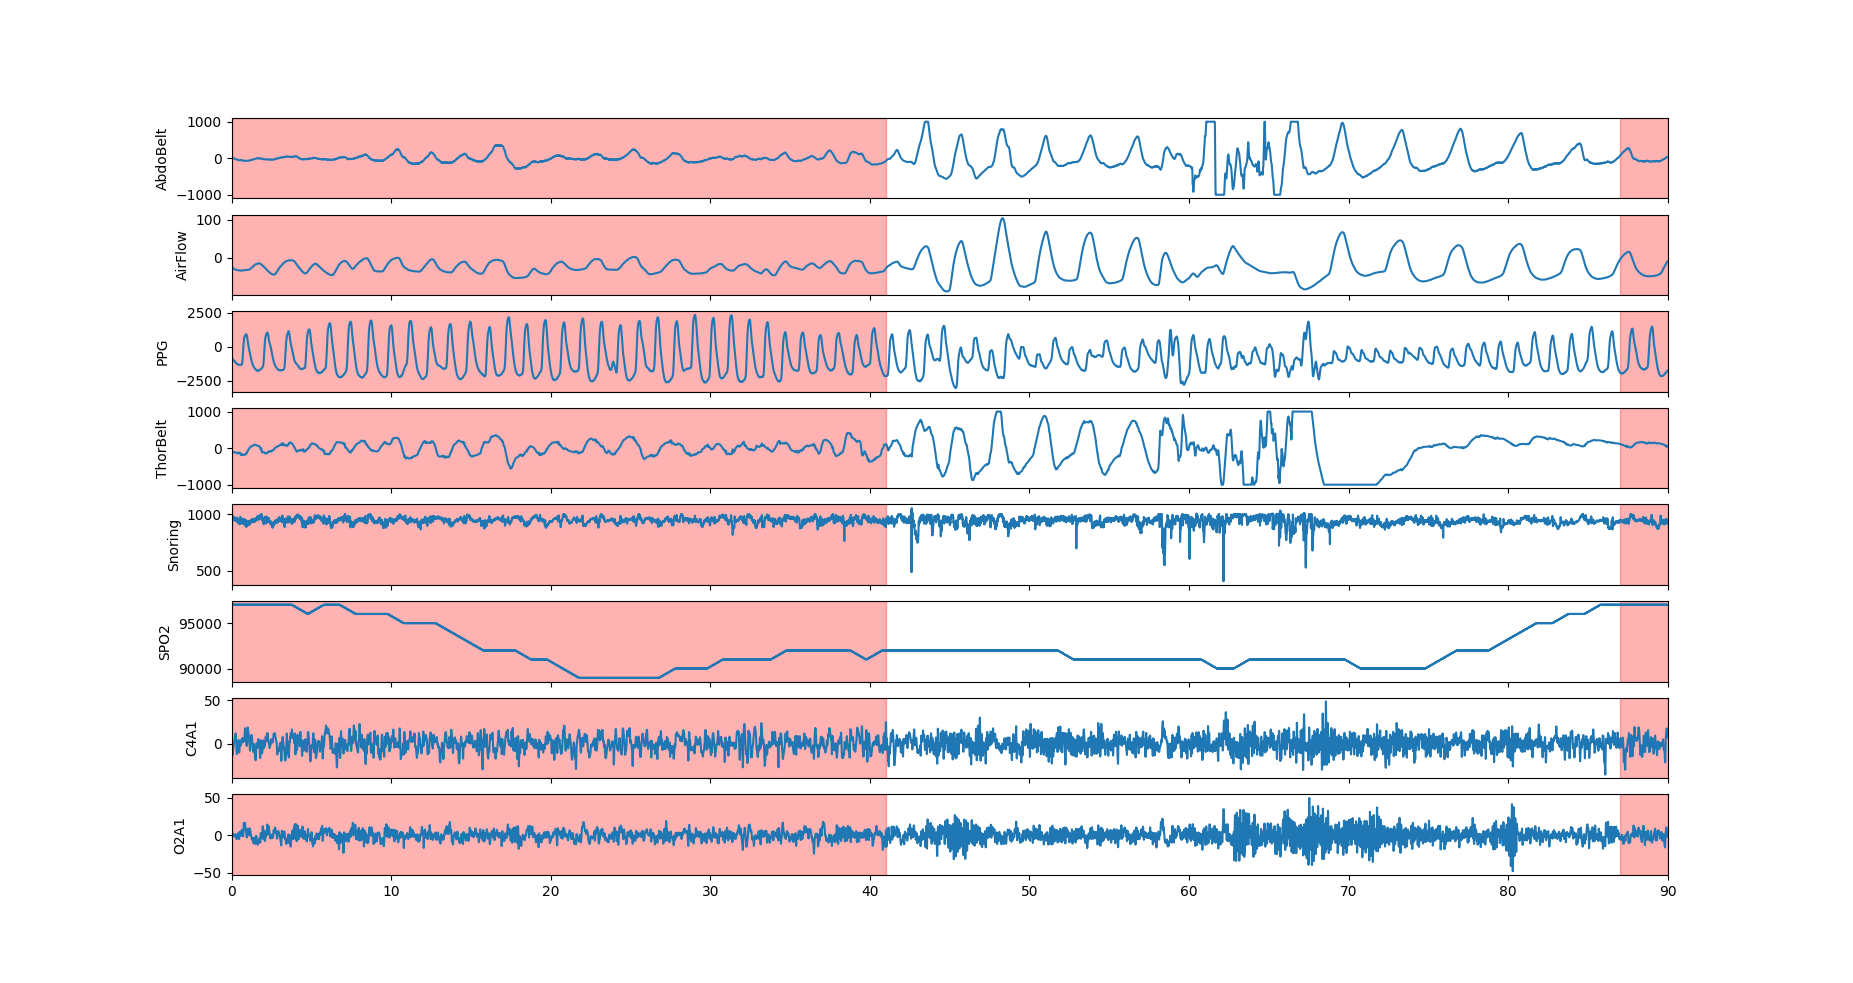
The 8 PSG signals with the associated segment mask. The apnea events is visible with Abdominal belt, thoracic belt and airflow amplitude dropping sensibly below baseline. The SPO2 drops after the event.
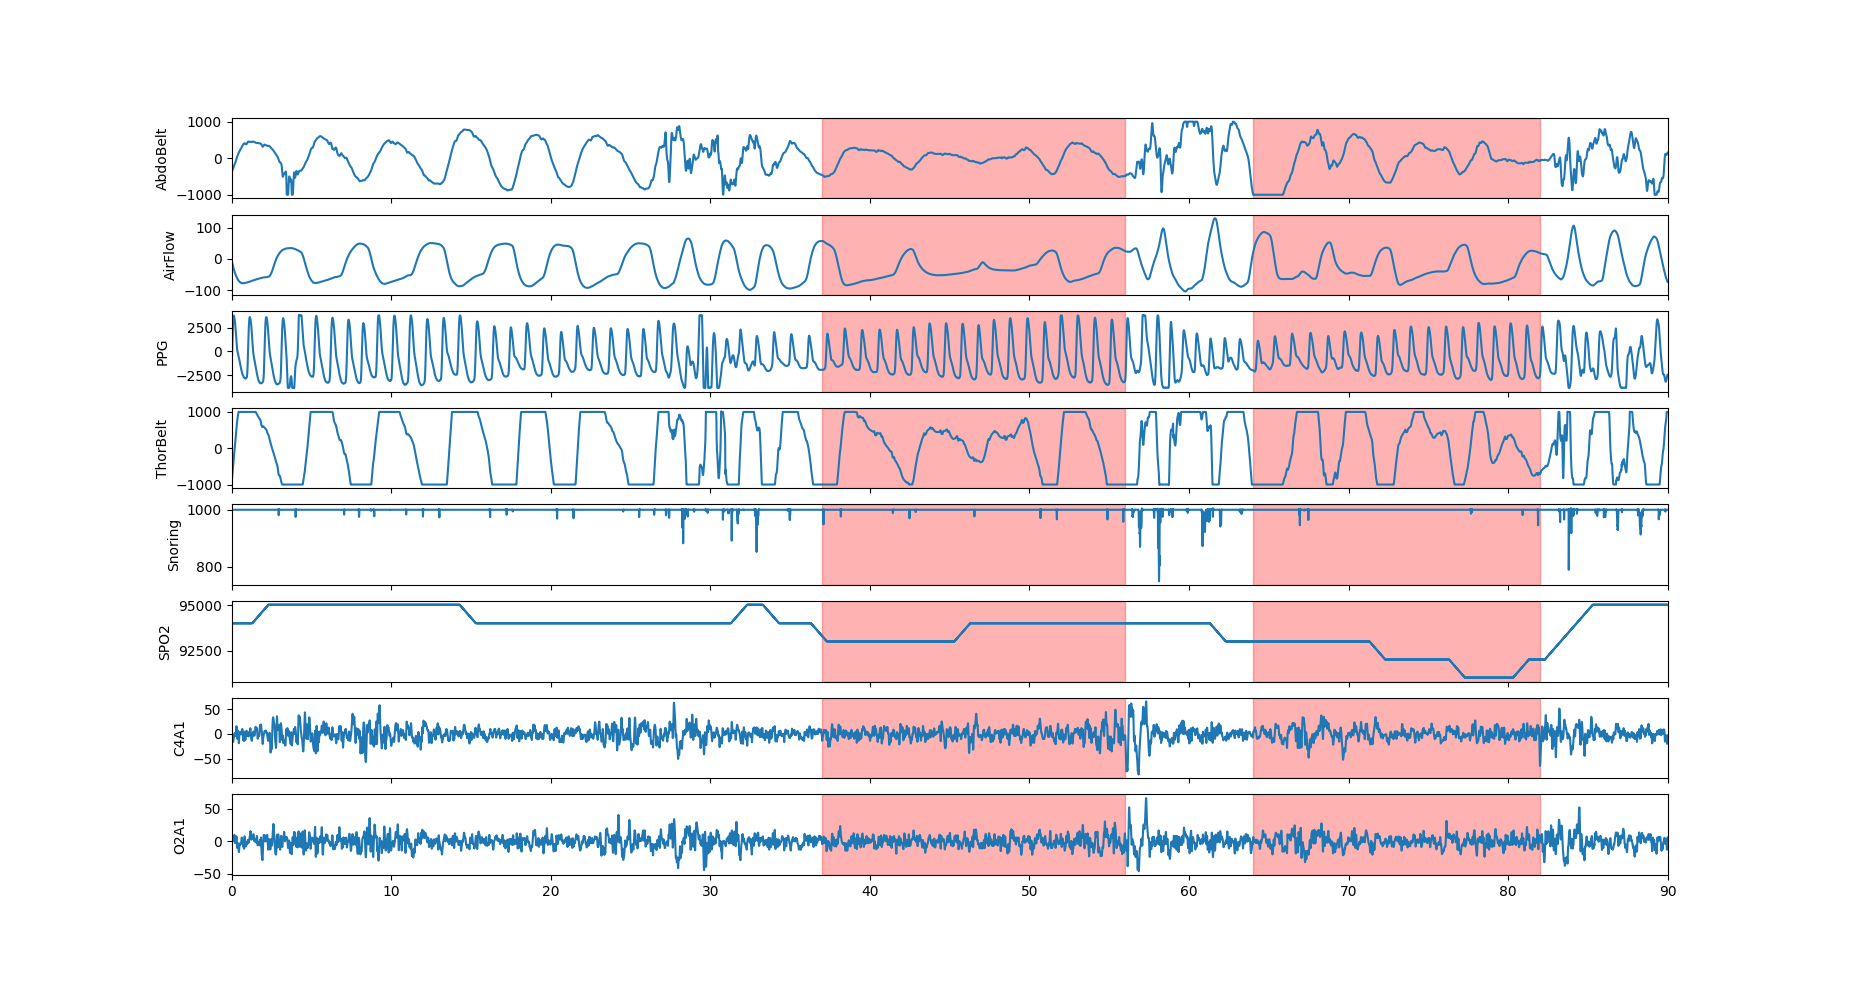
The 8 PSG signals with the associated segment mask. Two short apnea events are visible with the associated breathing disruption. The SPO2 drops during the second event is likely to be a consequence of the first event.
We want to assess if the events detected by the algorithm are in agreement with the one detected by the sleep experts.
As we seek to evaluate events-wise agreement between the model and the scorers, the metric cannot be computed directly on the segmentation mask. First, events are extracted from the binary mask with the following rule:
An apnea event is a sequence of consecutive 1 in the binary mask.
For each apnea events from a window, we extract the start and end index to produce a list of events. This list can be empty if not events are found. The same processing is applied to the ground-truth masks to extract the ground-truth events.
In order to assess the agreements between the ground-truth and estimated events, the F1-score is computed. Two events match if their IoU (intersection over union or Jaccard Index) is above 0.3.
Hence a detected event is a True Positive if it matches with a ground-truth event, it's a False Positive otherwise. On the other hand, a ground-truth event without a matching detected event is a False Negative. TP, FP, FN are summed over all the windows to compute the F1-score.
The detailed implementation can be found in the metrics file.
x_train.csv, x_test.csv: IDs of the input data used for training and for testing X_train.h5, X_test.h5: Training data for the training and testing set under the HDF5 format. They are stored in the supplementary file. The data can be accessed in Python using h5py.
Each row of x contains the data from a single window. The training set contains 4400 windows and the testing set 4400 windows.
x has 72002 columns which contains:
- 0: sample index
- 1: subject index
- 2 to 9001: Abdominal belt
- 9002 to 18001: Airflow
- 18002 to 27001: PPG (Photoplethysmogram)
- 27002 to 36001: Thoracic belt
- 36002 to 45001: Snoring indicator
- 45002 to 54001: SPO2
- 54002 to 63001: C4-A1
- 63002 to 72001:O2-A1
More details are available here:
- Python: http://docs.h5py.org/en/stable/quick.html
- R: https://www.neonscience.org/hdf5-intro-r
y_train.csv: csv file with ',' separator. The table has 91 columns, the first columns is the sample id and should match the one from the input data.
The 90 other columns (y_0, ..., y_89) contains the segmentation mask, the column y_i is the segmentation mask from the i-th second to the i+1-th second of the window.
These columns have to be integer be integer (0 or 1).
metrics.py: Code to compute the final F1 score. compute_f1_score_on_csv is used on the platform to compute the metrics.
visualisation.py: Code to visualise event and signals
The benchmark is a 3-layer CNN with two ConvPool layers with a downsampling factor 10 followed by a convolutional layer. The model is trained on all the signal. 70% of the training set is used for training, the remaining 30% are used for model validation.
Files are accessible when logged in and registered to the challenge
Challenge data is supported by:
