EDF R&D Saclay | Acquisition et traitement image/3D

31/01/22: we corrected an inaccuracy in the xtest and xtrain files. Please, check you have the latest versions. Also, due to the important number of points in the test set, the submission file weighs around 500MB. Please allow several minutes (up to 10) for the upload and scoring of your submissions.
Started on Jan. 5, 2022
Our Team is part of EDF Research & Development.
Electricité de France (EDF) is a French multinational utility company which activities include electricity generation and distribution, power plant design, maintenance and dismantling, electricity transport and trading. EDF Research & Development aims to:
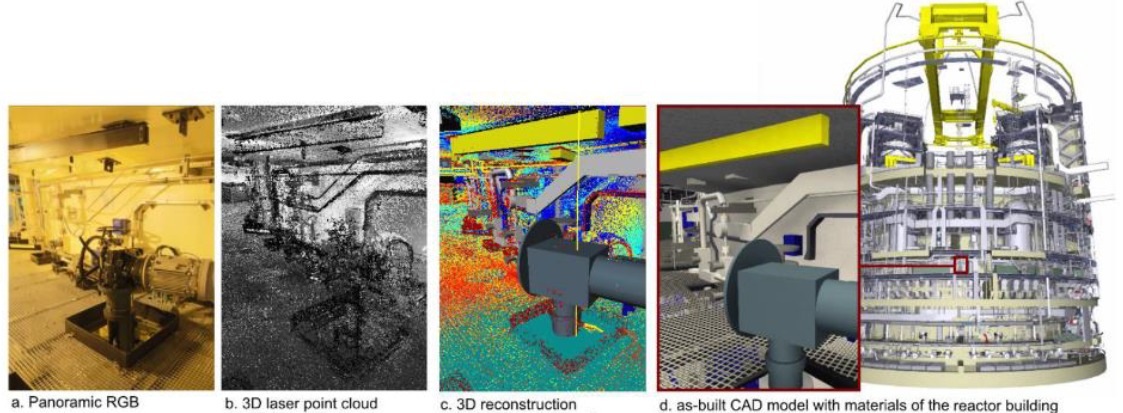
In the context of increased maintenance operation and generation renewal work, EDF has developed methods and tools to create and explore an « as-built digital mock-up » of entire industrial buildings using different data such as as-built 3D model, panoramic photographs, point clouds from laser scans. Particularly, our team leverages the use of the as-built digital mock-up by enriching semantically the photographs and 3D point clouds. It also explores automatic point clouds segmentation and CAD reconstruction.
The goal of this challenge is to perform a semantic segmentation of a 3D point cloud.
The point cloud of one EDF industrial facility digital mock-ups is composed of 45 billions of 3D points. The reconstruction work consisting of the fitting of 90 000 geometric primitives on the point cloud. To perform this task, the operators have to manually segment part of the point cloud corresponding to an equipment to then fit the suitable geometric primitive. This manual segmentation is the more tedious of the global production scheme. Therefore, EDF R&D studies solutions to perform it automatically.
Because EDF industrial facilities are sensitive and hardly accessible or available for experiments, our team works with the EDF Lab Saclay boiling room. The digital mock-up of this test environment has been produced with the same methodology than the other industrial facilities.
For the ENS challenge, EDF provides a dataset with a cloud of 2.1 billion points acquired in an industrial environment, the boiling room of EDF Lab Saclay whose design is sufficiently close to an industrial building for this segmentation task. Each point of the cloud has been manually given a ground truth label.
The project purpose is a semantic segmentation task of a 3D point cloud. It consists in training a machine learning model to automatically segment the point cloud in different classes where is the point cloud size. The model infers a label class for each point .
To assess the results, we compute the weighted F1-score over all classes (sklearn.metrics.f1_score). It is defined by:
where , are respectively the point-wise precision and recall of the class , and is the inverse of the number of true instances for class .
The boiling room was digitized with LiDAR scanners on tripods and contains 67 scanner positions. Each acquisition at one scanner position (which is called “station”) produces one point cloud of about 30 millions of points. The point clouds of the set of stations are registered in a single reference frame. Randomly subsampled point clouds will be provided. The train set contains 50 stations point cloud and the test set contains the remaining 18 stations. The compressed and subsampled dataset weighs 2 Go.

The input variables are point clouds where is the point cloud size and , whose coordinates are :
The station-wise point cloud will be provided in compressed PLY format. Here is an example of the header:
format binary_little_endian 1.0
comment Trimble – RealWorks
obj_info Point Cloud Generated by Trimble RealWorks 11.9
element point 38335195
property float x
property float y
property float z
element color 38335195
property uchar red
property uchar green
property uchar blue
element intensity 38335195
property uchar variation
The PLY point cloud can be read with the python Library plyfile.
The output variables are the segmentation classes where , and is the number of class. The classes are:
The ground truth file will be provided in a unique CSV file. The CSV file contains as many lines as points of cloud PLY. For each line, the first element is the point index followed by the class labels.
An additional file map_ind_station.csv provides the mapping between the point index and its station index. Its lines are of the form:
station_id, point_id_low, point_id_high
which means that points corresponding to the station station_idx are assigned the index range from point_id_low to point_id_high, both ends included. These index ranges must be used in the submitted CSV prediction file as well:
ID,class
83645062,0
83645063,0
...
93562962,1
106424117,2
...
The benchmark is a constant function which predicts the majority class 3 (Civils) for every point.
Files are accessible when logged in and registered to the challenge
Challenge data is supported by:
